

Current-Account Deficit Expanded by 44.3% in Q1
Current-Account Balance (Table 1 and Chart 1)
In the first quarter of 2025, the U.S. current-account deficit—which summarizes the net flows of trade in goods and services and income between U.S. residents and those abroad—widened sharply by $138.2 billion (or 44.3%) to reach $450.2 billion, according to data released by the U.S. Bureau of Economic Analysis (BEA). The revised deficit for the fourth quarter of 2024 stood at $312.0 billion (see Table A).
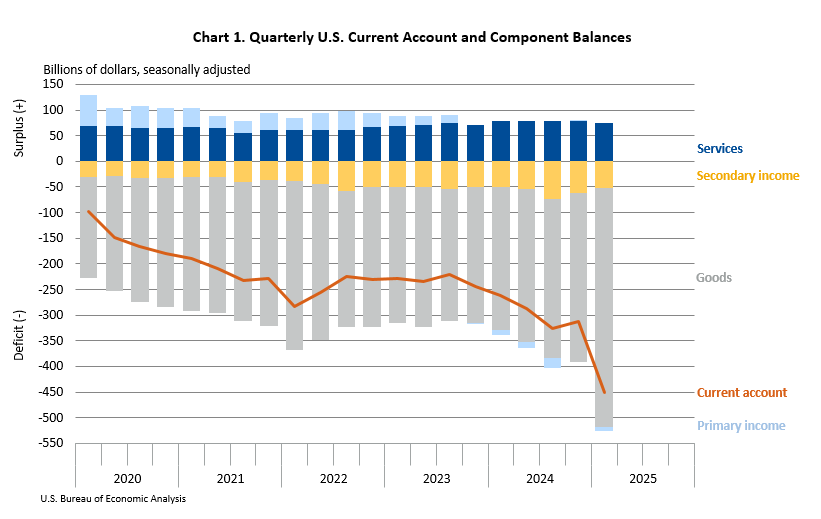
This first-quarter deficit represented 6.0% of the current-dollar gross domestic product (GDP), a notable rise from the 4.2% seen in the previous quarter.
The majority of the $138.2 billion increase in the current-account gap can be attributed to a growing trade deficit in goods.
Quarterly U.S. Current-Account and Component Balances
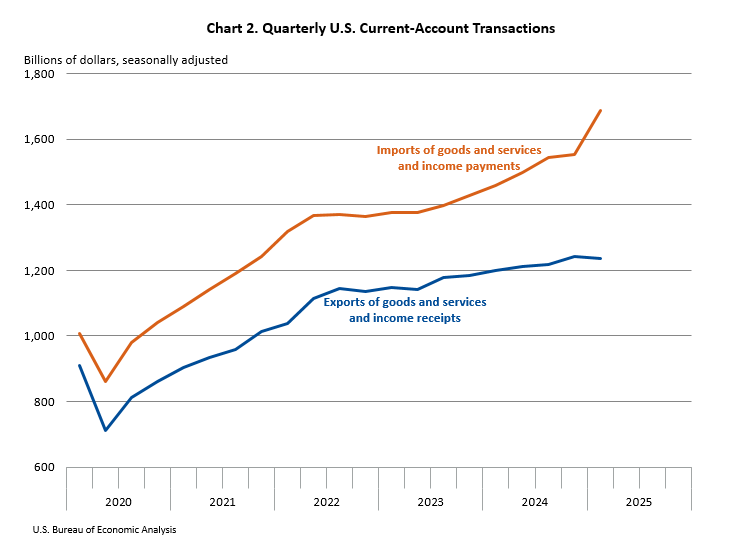
Current-Account Transactions (Tables 1–5 and Chart 2)
Combined exports of goods and services, along with income received from foreign sources, declined slightly by $3.9 billion, totaling $1.24 trillion. In contrast, imports of goods and services and payments to foreign residents surged by $134.3 billion, totaling $1.69 trillion.
Trade in Goods (Table 2)
Goods exports rose by $21.1 billion to $539.0 billion. This growth was mainly driven by increased exports of capital goods, particularly civilian aircraft and computer-related products (accessories, parts, and peripherals). Meanwhile, goods imports jumped significantly—by $158.2 billion—reaching $1.00 trillion. This was led by increased imports of nonmonetary gold and consumer products, especially pharmaceutical, dental, and medicinal goods. (Refer to the “Goods” section in “Additional Information” for the definition of nonmonetary gold.)
Trade in Services (Table 3)
Exports of services fell by $4.4 billion to $293.2 billion. The drop primarily stemmed from decreased government services (notably military units and agencies), lower travel services (especially “other personal travel”), and reductions in “other business services,” including professional and management consulting. However, there was a partial offset due to growth in maintenance and repair services.
Service imports also declined by $1.8 billion to $217.8 billion, mainly due to reduced charges for the use of intellectual property particularly license payments linked to research and development outputs.
Primary Income (Table 4)
Primary income receipts fell by $22.9 billion, totaling $355.1 billion, while payments decreased by $13.7 billion to $362.7 billion. Both trends were influenced by lower direct investment income, primarily reflecting reduced earnings.
Secondary Income (Table 5)
Secondary income receipts increased by $2.3 billion to $49.6 billion. This was largely due to higher private transfers, such as fines and penalties. Meanwhile, secondary income payments fell by $8.4 billion to $101.5 billion, driven by a reduction in government transfers, particularly those related to international cooperation.
Capital-Account Transactions (Table 1)
Capital-transfer receipts dropped by $2.4 billion to $8.9 billion. The decline stemmed from lower payouts by foreign insurers related to Southern California wildfires in Q1 compared to higher receipts in Q4 due to Hurricane Milton.
Capital-transfer payments slightly rose by $0.5 billion to $2.0 billion.
For details on how insurance transactions are handled in the international accounts, see the section titled “How do losses recovered from foreign insurance companies following natural or man-made disasters affect foreign transactions…”
Financial-Account Transactions (Tables 1, 6, 7, 8 and Chart 3)
In Q1, net financial-account transactions amounted to −$299.5 billion, indicating continued U.S. borrowing from foreign sources.
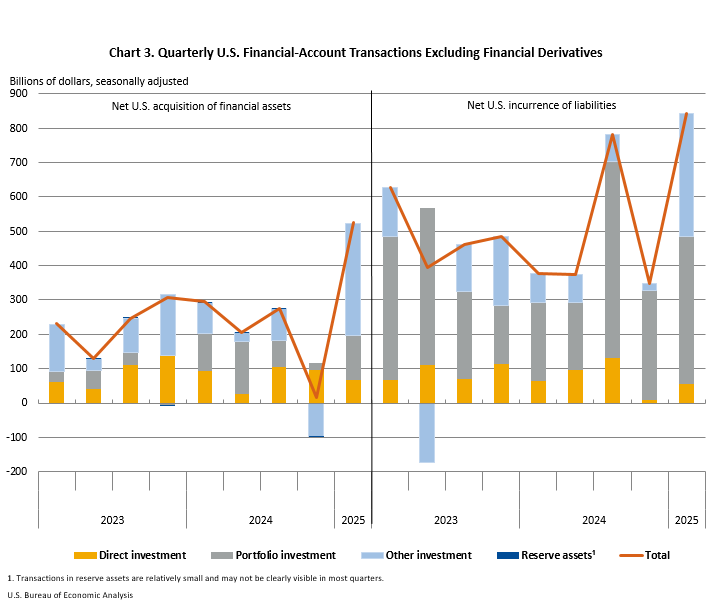
Financial Assets (Tables 1, 6, 7, and 8)
During the first quarter, U.S. residents increased their holdings of foreign financial assets by $524.9 billion. Key changes included:
Other investment assets (mainly short-term loans): +$328.2 billion
Portfolio investment assets (mostly debt securities): +$128.4 billion
Direct investment assets (primarily equity): +$66.8 billion
Reserve assets: +$1.5 billion
Financial Liabilities (Tables 1, 6, 7, and 8)
U.S. liabilities to foreign investors increased by $843.7 billion, driven by:
Portfolio investment liabilities (mainly long-term debt securities): +$429.9 billion
Other investment liabilities (short-term deposits and loans): +$358.9 billion
Direct investment liabilities (mostly equity): +$54.9 billion
Financial Derivatives (Table 1)
Net transactions in financial derivatives totaled $19.3 billion for Q1, reflecting net U.S. lending to foreign entities.
Table A: Revisions to Q4 2024 International Transactions
| Category | Preliminary | Revised |
|---|---|---|
| Current-account balance | –303.9 | –312.0 |
| Goods balance | –326.1 | –328.9 |
| Services balance | 76.1 | 78.0 |
| Primary income balance | 2.3 | 1.6 |
| Secondary income balance | –56.2 | –62.6 |
| Net financial-account transactions | –385.3 | –350.8 |
Source: U.S. Bureau of Economic Analysis
Annual Update to the U.S. International Transactions Accounts
This release includes the BEA’s annual update to the U.S. International Transactions Accounts, which incorporates:
-
Newly available and revised source data
-
Recalculations of seasonal and trading-day adjustments dating back to 2018
-
Data from the 2022 Benchmark Survey of Transactions in Selected Services and Intellectual Property
-
A new balance of payments adjustment redistributing late Canadian goods receipts
-
A revised method for estimating transactions in “other investment” by maturity
-
New statistics for transactions involving a repurchase agreement facility for foreign and international monetary authorities
Table 9 (not shown) provides a summary of key aggregate revisions.
Table B: New & Revised Source Data Providers
| Agency | Data Provided | Years Affected |
|---|---|---|
| U.S. Bureau of Economic Analysis | Quarterly & benchmark surveys on international trade in services | 2018–2024 |
| Annual and quarterly surveys on direct investment | 2022–2024 | |
| U.S. Census Bureau | Revised international goods trade data | 2022–2024 |
| U.S. Department of the Treasury | Portfolio & investment surveys (quarterly/monthly & benchmark) | 2022–2024 (monthly), 2023–2024 (benchmark) |
For more insights, refer to “Preview of the 2025 Annual Update of the International Economic Accounts” in the Survey of Current Business. The full annual update will be detailed in the July 2025 issue. Updates to the U.S. International Economic Accounts: Concepts and Methods will follow in September 2025.